


Key Takeaways
- Physical therapy patient acquisition cost (PAC) is the total marketing and operational investment required to generate one new booked patient — and most PT practices are measuring it incorrectly, or not at all.
- Cost per lead (CPL) and patient acquisition cost are different metrics. CPL measures marketing efficiency. PAC measures full-funnel efficiency — including the conversion gap between inquiry and booked evaluation.
- A low cost per lead can become a far higher fully loaded patient acquisition cost after intake funnel drop-off, no-shows, and onboarding losses — published CPL benchmarks alone understate true PAC.
- Patient acquisition costs have climbed sharply in recent years across healthcare specialties. Organic SEO typically delivers a lower CPL and a stronger close rate than paid search — making content and local search the highest-ROI channels for most PT practices.
- PAC must always be evaluated against patient lifetime value (LTV). A $300 PAC for a patient with a $2,400 LTV is a different business decision than a $300 PAC for a patient with a $600 LTV.
- The fastest way to reduce PAC without reducing patient volume is to close conversion gaps in the inquiry-to-booking process — improving conversion rate from existing lead volume rather than generating more leads at the same conversion rate.
Table of Contents
Physical therapy patient acquisition cost is the metric that reveals whether a practice’s marketing investment is producing patients at a sustainable unit economics level — or generating activity that does not translate to revenue at a defensible cost. Most PT practices can name their monthly marketing spend. Fewer can name their cost per new booked patient by channel. Without that number, marketing decisions are directional guesses rather than data-driven investments.
The acquisition playbook covers the five patient acquisition channels that make up a diversified PT pipeline. This article goes deeper on the economics of those channels — how to calculate patient acquisition cost correctly, how to benchmark it, and how to reduce it without cutting the patient volume the practice needs to grow.
The context matters: patient acquisition costs have climbed sharply in recent years across healthcare specialties. Paid search costs in this category are still rising — Health and Fitness CPL rose 7.3% year-over-year in 2025–2026 per WordStream’s benchmark of 13,474 US campaigns. The practices managing their PAC actively are making better channel decisions and maintaining unit economics that make growth sustainable rather than increasingly expensive. For a deeper treatment of this topic, see the acquisition playbook.
Why Patient Acquisition Cost Matters More Than Marketing Spend
Marketing spend is an input. Patient acquisition cost is an output ratio — the relationship between that spend and the patients it produces. A practice spending $3,000 per month on Google Ads and generating 8 new patients has a paid search PAC of $375. A practice spending $1,500 per month on local SEO and content and generating 12 new patients has an organic PAC of $125. The second practice is generating 50% more patients at one-third the per-patient cost. Practices tracking this metric can also review the educational hub for additional benchmarks.
Those are structurally different businesses even when the monthly spend difference is modest. How the five acquisition channels work together to generate that patient volume is mapped in the patient acquisition pipeline guide. How the five acquisition channels work together to generate that patient volume is mapped in the patient acquisition pipeline guide. The content systems provides additional context on this topic.
The PT industry hub tracks how channel mix affects PAC across independent PT markets. The consistent finding is that practices with the lowest PAC are those with the highest proportion of organic and owned channel acquisition — local search, direct access patient education, and past-patient reactivation — and the lowest reliance on paid media for new patient volume. The growth blueprint frames how PAC reduction connects to long-term competitive positioning.
CPL vs Physical Therapy Patient Acquisition Cost: The Critical Distinction
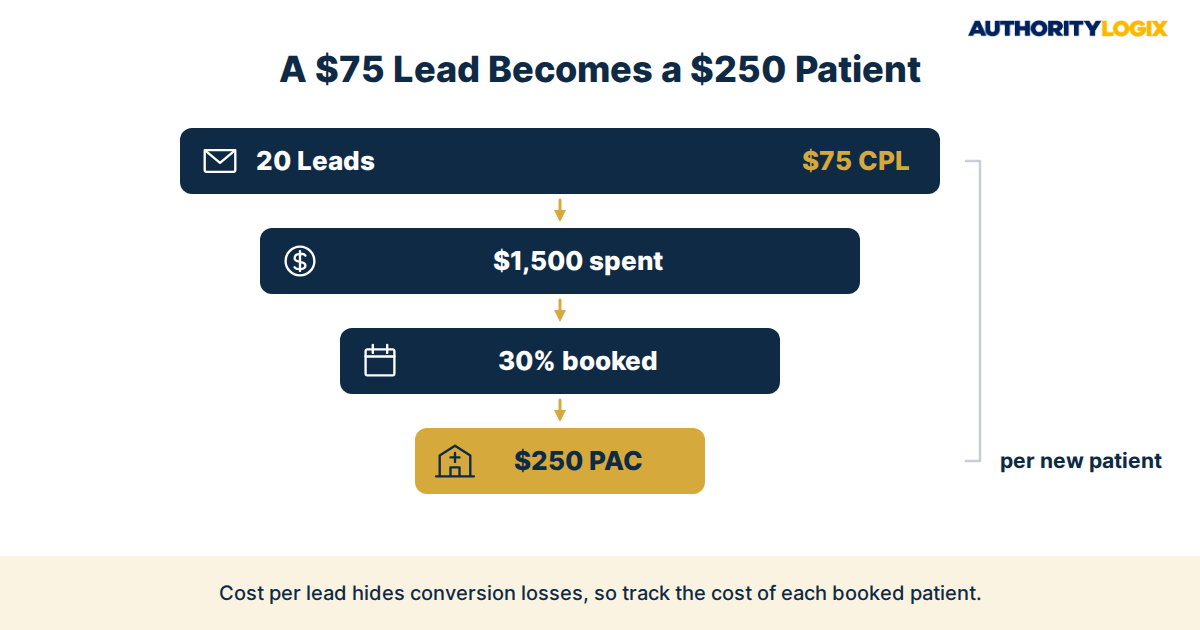
Cost per lead (CPL) and patient acquisition cost (PAC) measure different things. CPL is what it costs to generate an inquiry — a phone call, a form submission, a GBP direction request. PAC is what it costs to convert that inquiry into a booked, arrived, and treated patient. If a practice generates 20 leads at a $75 CPL and converts 30% of them into booked patients, the PAC is $250 — not $75. Both metrics matter: CPL reveals marketing efficiency; PAC reveals full-funnel efficiency including conversion rate, response speed, and show rate. For a deeper treatment of this topic, see the patient acquisition pipeline.
Published CPL benchmarks can understate true PAC considerably once intake funnel drop-off, no-shows, and onboarding losses are counted. A practice that tracks CPL but not PAC is optimizing the wrong metric — and may be systematically underinvesting in conversion infrastructure that would reduce PAC far more effectively than reducing CPL.
The Physical Therapy Patient Acquisition Playbook covers the full acquisition system behind a lower, more predictable cost per new patient.
How to Calculate Physical Therapy Patient Acquisition Cost
Calculating PAC correctly requires tracking four numbers: total marketing spend for the period (including agency fees, ad spend, content production costs, and SEO investment), total new patients acquired in the same period, the conversion rate from inquiry to booked evaluation, and the show rate from booked to arrived. Most practice management software tracks new patients per month. Connecting that number to the marketing investment that generated those patients — by channel — is the step most practices skip.
The formula is straightforward: PAC = total marketing spend ÷ new patients acquired. By channel: organic PAC = organic channel investment ÷ new patients from organic sources. Paid PAC = paid ad spend ÷ new patients from paid sources. Tracking PAC by channel is what enables rational channel budget decisions — rather than allocating spend based on activity metrics like impressions or clicks that do not connect to patient revenue. The PT Authority Gap Assessment → assessment produces the channel attribution analysis that makes PAC by source calculable for practices that have not tracked it previously. For a deeper treatment of this topic, see the growth blueprint.
Tracking New Patient Source Attribution
Source attribution — knowing which channel produced each new patient — is the prerequisite for PAC calculation by channel. The minimum viable attribution system for a PT practice requires one field in the intake process: “How did you hear about us?” with specific answer options that map to marketing channels. Options should include: Google search, Google Maps, physician referral (with the physician name), friend or family referral, website, social media, and other. Tracking this field consistently across 90 days produces a statistically meaningful channel distribution.
More precise attribution is available through UTM parameters on digital campaigns (tracking which specific ad or page generated a form submission), call tracking numbers assigned to specific channels, and Google Analytics 4’s source attribution for website conversions. These tools add precision but are not required to start. A manually tracked “how did you hear about us?” field, consistently applied for 90 days, provides the channel distribution data needed to calculate a meaningful PAC baseline. The lead generation system includes the attribution tracking framework that makes this calculation automatic.
Not sure what your practice’s PAC is by channel?
Patient Acquisition Cost by Channel — PT Practice Benchmarks
PAC benchmarks for physical therapy practices vary widely by market and channel. Paid search cost per lead varies widely by specialty, so a PT practice should benchmark its CPL against its own local market. Non-branded CPL varies widely across mid-size US PT markets, so benchmark it against comparable local markets. The relevant benchmark for any individual practice is not the specialty average — it is the channel-specific PAC relative to that channel’s patient LTV contribution.
Organic Search and Local SEO PAC
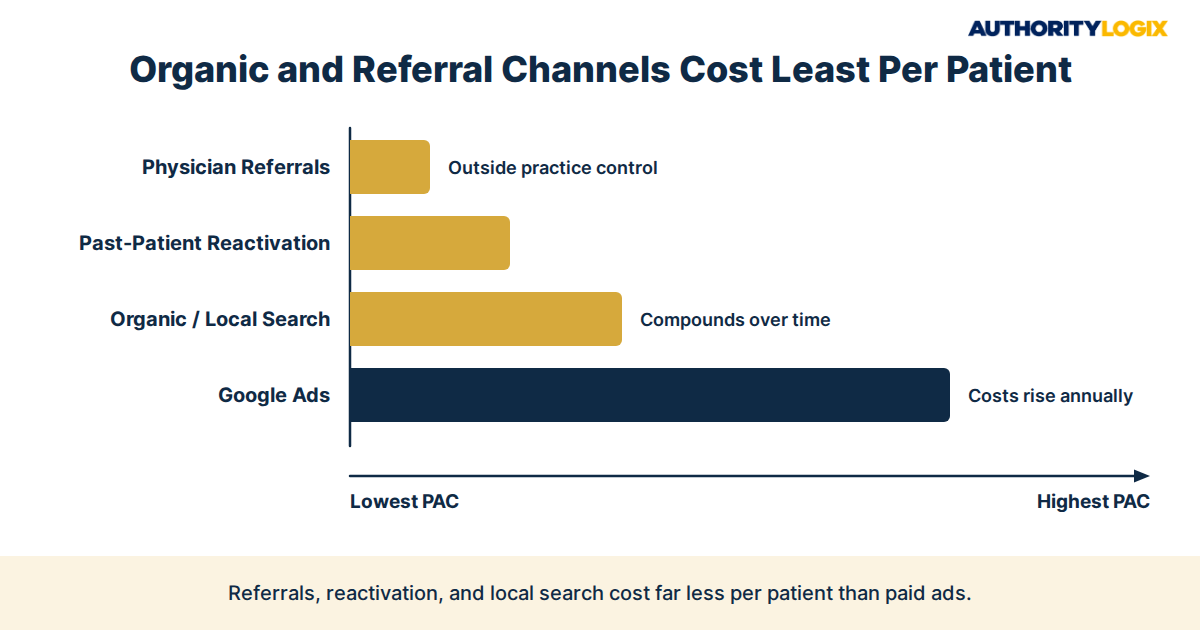
Organic search and local SEO consistently produce the lowest PAC of any active acquisition channel for PT practices. Organic SEO typically delivers a lower CPL and a stronger close rate than paid search. The higher close rate of organic leads reflects their self-qualification — a patient who arrived through a condition-specific search has already confirmed the practice treats their condition before contacting it. To diagnose this issue in your own practice, use the authority gap assessment.
The PAC advantage of organic and local search compounds over time because the investment is front-loaded. A condition page published and optimized today generates patient inquiries for months or years — at zero incremental cost per visitor. As Health and Fitness paid search costs keep rising, the relative PAC advantage of organic widens every year. The content playbook covers the keyword strategy and page structure that makes each new condition page a compounding organic acquisition asset.
Paid Search PAC
Google Ads for PT practices generate leads at a wide range of CPLs depending on market, competition, and keyword specificity. Branded keyword campaigns — targeting the practice’s own name — typically produce the lowest CPL and highest close rate but generate limited incremental volume. Non-branded condition and location campaigns generate more new patient volume but at higher CPL and lower close rates, requiring careful conversion optimization to produce acceptable PAC.
The fully loaded PAC for paid search is significantly higher than the headline CPL suggests. A $100 CPL at a 20% inquiry-to-booking conversion rate produces a $500 PAC before accounting for no-shows. Reducing no-show rates through pre-visit education and confirmation systems materially reduces paid search PAC without changing ad spend. The local visibility guide covers how local SEO complements paid search to reduce overall channel CAC as organic authority builds.

Reducing Physical Therapy Patient Acquisition Cost Without Cutting Volume
The fastest path to lower PAC is not cutting marketing spend — it is improving conversion rate from existing lead volume. A practice generating 30 leads per month at a 25% conversion rate produces 7–8 new patients. Improving conversion to 40% produces 12 new patients from the same 30 leads — a roughly 50–60% increase in patient volume at zero increase in marketing cost. That conversion rate improvement is the highest-ROI PAC reduction lever available to most PT practices. For a deeper treatment of this topic, see the local visibility guide.
Conversion Rate as a PAC Lever
Conversion rate improvements that reduce PAC without affecting lead volume include: faster inquiry response (reducing the leads that go cold while waiting for a callback), online scheduling (eliminating the friction between inquiry and booking), and pre-visit education that reduces no-show rates. Each of these is an operational change, not a marketing investment — and each one reduces the denominator of the PAC calculation by increasing the number of patients produced per lead generated. The acquisition playbook maps the full conversion optimization sequence.
Shifting Channel Mix Toward Organic
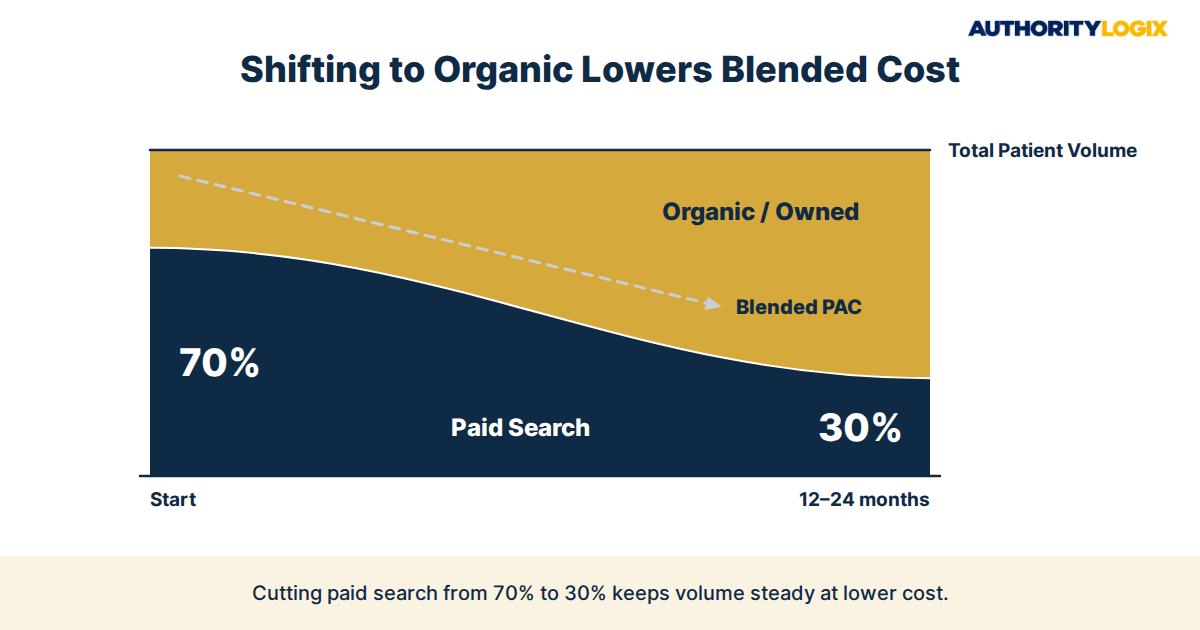
The structural PAC reduction strategy for PT practices is shifting channel mix from paid to organic over 12 to 24 months. As condition pages, GBP authority, and review volume compound, they generate increasing organic patient volume — while paid ad costs rise annually. A practice that reduces paid search dependence from 70% of new patient volume to 30%, while growing organic channels to compensate, reduces its blended PAC materially without reducing total patient volume.
Content marketing generates three times as many leads as traditional outbound marketing at 62% less cost, per Demand Metric’s cross-industry content marketing research. For a PT practice, this means that investing in condition pages, clinician bio pages, and local authority content simultaneously reduces PAC and builds the competitive authority that makes the practice harder to displace. The education guide covers the content investment priorities that produce the highest PAC-reduction impact per dollar spent. For a deeper treatment of this topic, see the patient journey guide.
FAQ: Physical Therapy Patient Acquisition Cost
What is a good patient acquisition cost for a PT practice?
There is no universal benchmark because PAC must be evaluated against patient LTV. A PT practice with an average LTV of $1,200 (six sessions at $200 each) has very different acceptable PAC thresholds than one with a $3,600 LTV (ongoing care or recurring conditions). A common planning guideline is that PAC should stay at a small fraction of patient LTV for the business model to be sustainable. The authority gap assessment calculates PAC by channel and benchmarks it against the practice’s actual LTV data.
How does physician referral PAC compare to digital channel PAC?
Physician referral PAC is often the lowest of any channel — the direct cost of maintaining referral relationships is minimal relative to the patient volume they generate. But referral PAC is deceptive because it does not capture the opportunity cost of relying on a channel the practice does not control. When a referral relationship disrupts, the effective PAC for replacing that volume through digital channels is often far higher than the referral PAC had been. The local visibility guide covers how local search builds the owned channel that provides referral replacement volume at the lowest possible PAC.
How often should a PT practice review its PAC by channel?
Monthly PAC tracking by channel is the right cadence for active marketing investment decisions. Quarterly reviews are the minimum for practices with smaller marketing budgets. The review should compare PAC this period against the prior period by channel — identifying whether channels are becoming more or less efficient — and flag any channel where PAC is rising faster than patient LTV would justify continued investment. APTA practice management resources recommend quarterly marketing performance reviews as a standard operational practice for independent PT clinics of any size.
Does improving SEO actually reduce patient acquisition cost?
Yes — and the effect compounds over time. Organic SEO typically delivers a lower cost per lead than paid search, and organic leads often close at a higher rate than paid search leads. A practice investing consistently in condition pages, GBP optimization, and local authority builds a patient acquisition asset that generates patients at lower and lower effective PAC as the organic traffic base grows — while paid search costs rise annually. The lead generation system integrates SEO and paid search into a channel mix that optimizes blended PAC over the 12–24 month horizon. The patient journey guide covers related acquisition dynamics. For the full specialty framework, visit the PT resources hub.
Measuring What Actually Drives Patient Revenue
Physical therapy patient acquisition cost is the metric that connects marketing investment to business outcomes. Tracking it by channel, benchmarking it against patient LTV, and actively managing both conversion rate and channel mix gives a PT practice the visibility to make marketing decisions based on unit economics rather than activity or anecdote.
The Insight Articles in the Patient Acquisition library go deeper on every channel — from organic SEO cost efficiency and local search attribution to conversion rate optimization and paid search management. The PT resources hub organizes the full library so practice owners can move directly to the specific PAC challenge they are solving today. The lead generation funnel offers additional context on this area. The PT industry hub demonstrates how the five-system framework — content, local search, patient education, lead generation, and authority distribution — lowers patient acquisition cost as each system matures.
Want to lower your patient acquisition cost with channels that compound instead of renting attention?