


Key Takeaways
- Financial services content infrastructure vs ads is a choice between an asset that keeps producing inquiries and a rental that ends the day the budget does.
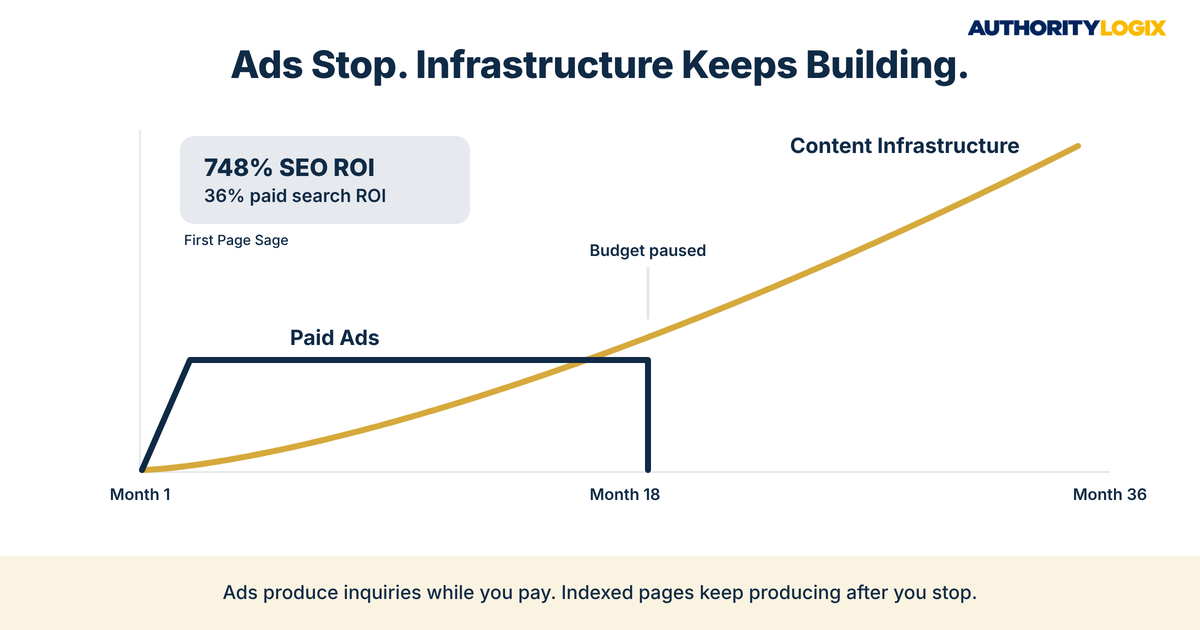
- First Page Sage’s research puts the three-year return on SEO at 748% against 36% for paid search, with SEO breaking even in about nine months versus about four.
- WordStream’s 2026 Google Ads benchmarks show Finance and Insurance with the lowest conversion rate of any industry, 2.64%, and a median cost per lead of $74.44.
- HubSpot found that compounding posts, roughly 10% of a blog, generate 38% of its traffic — one such post performs like six regular posts.
- Paid ads still have a job: testing messages, covering new program launches, and retargeting readers the content already attracted.
- The fair test of financial services content infrastructure vs ads is cost per inquiry over 36 months, not cost per click this month.
Table of Contents
Financial Services Content Infrastructure vs Ads: The Core Math
Financial services content infrastructure vs ads is the budget decision most mortgage companies, DSCR lenders, and advisory firms make by default instead of on purpose. A lender with 20 years of closed loans buys clicks because clicks are measurable this week, while the expertise that should be generating inquiries sits unpublished. That is the credible but invisible pattern, and it is expensive.
The difference between the two shows up in what remains when spending pauses. An ad produces a visit while the meter runs, but an indexed page keeps answering borrower questions for years, which is why organic leads behave so differently from purchased or rented ones over time. One is an expense line. The other is an asset that keeps working.
First Page Sage’s channel research, compiled in this Webtonic statistics roundup, puts the three-year return on SEO at 748%. Paid search returned 36%. SEO took about nine months to break even, against about four months for paid search — which is exactly why ads feel safer in the first quarter and cost more by the third year.
Why Financial Services Content Infrastructure vs Ads Is a Timing Question
Financial services content infrastructure vs ads only looks like a close call when the measurement window is one quarter. Ads win the first 90 days because they start immediately. Infrastructure wins the periods after that, because the pages built in month one are still working in month 30, and every new page adds to the base instead of replacing it.
Trust is the other half of the math. Borrowers and investors in a skeptical market rarely hand a six-figure decision to the first sponsored result they see; they want evidence of expertise, which is the subject the authority guide treats in depth. Ads can buy the first look. They cannot buy the credibility that turns a look into a call.
For firms mapping what that infrastructure includes, the AuthorityLogix services hub breaks it into five connected systems: content, finance content development, educational hubs, lead generation, and authority distribution. Each system has its own job, and each one strengthens the others.
The Financial Services Growth Playbook shows how lenders, advisors, and firms build visibility that keeps growing instead of renting attention one click at a time.
Mortgage Organic Growth vs Paid Ads Over 36 Months
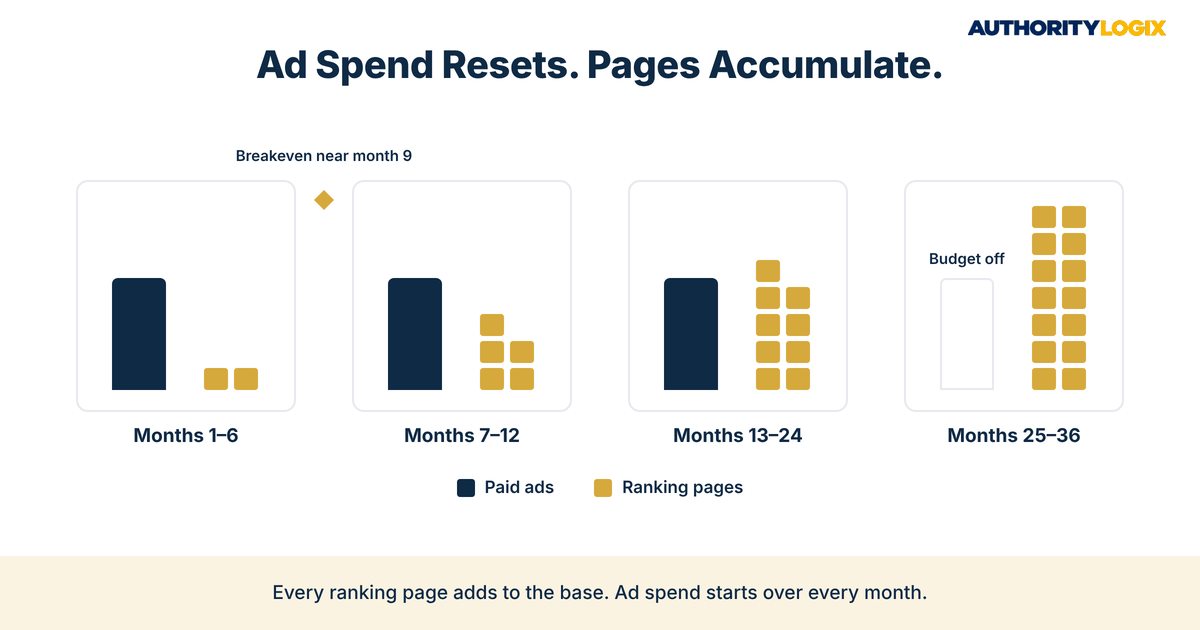
Mortgage organic growth vs paid ads is the lending version of financial services content infrastructure vs ads, and it plays out over years, not campaigns. In months one through six, paid search delivers inquiries while new pages are still being indexed and earning trust. Somewhere between month six and month twelve, the curves cross. After that, the content side keeps climbing while the ad side stays flat at whatever the budget buys.
The reason is structural. Each page that earns a position becomes a fixed asset, and the long-term rankings it holds do not reset on the first of the month the way an ad budget does. A lender who publishes four strong pages a month for three years owns 144 pages working at once. A lender who spends the same money on clicks owns nothing in month 37.
WordStream’s 2026 Google Ads benchmarks, based on 13,474 US search campaigns, put the overall median cost per click at $5.42. That price is paid again for every visit, from every borrower, for as long as the campaign runs. A ranking page has a production cost up front and a maintenance cost after, but its next visitor costs close to nothing. In financial services content infrastructure vs ads terms, that is the difference between a flat cost line and a falling one.
What Financial Services Content Infrastructure vs Ads Looks Like Month by Month
| Window | Paid Ads | Content Infrastructure |
|---|---|---|
| Months 1–6 | Inquiries start within days; cost per lead set by the auction | Pages indexed; early rankings on specific borrower questions |
| Months 7–12 | Same cost per lead, often higher as competitors bid up terms | Breakeven zone; First Page Sage puts SEO breakeven near nine months |
| Months 13–24 | Output stays tied to monthly spend | Library grows; older pages keep producing inquiries |
| Months 25–36 | Pause spending and inquiries fall to zero | Pause publishing and existing pages keep ranking |
The table is a simplification, but the shape holds across markets. What speeds up the content side of financial services content infrastructure vs ads is organization: pages grouped by borrower question and linked to one another rank faster than isolated posts, which is the logic behind an educational hub rather than a date-ordered blog. A hub gives every answer a permanent address and gives search engines a clear map of what you know.
Advisor Content Compound Growth and Why It Accelerates
Advisor content compound growth is the advisory version of the same financial services content infrastructure vs ads question, and the advisory data makes it easy to see. The 2026 Kitces Report on how financial planners market their services, a survey of 506 advisors, put the average client acquisition cost at $2,551. The same research found SEO cost about 45 cents of marketing spend per dollar of new client revenue, below the 70-cent average across all channels.
HubSpot’s research on its own blog explains why the curve bends upward. Roughly 10% of posts become compounding posts whose traffic grows over time, and those posts generate 38% of total blog traffic. By HubSpot’s math, one compounding post brings in as much traffic as six regular posts, and that ratio is the engine of the advisor side of financial services content infrastructure vs ads.
Compounding also changes the competitive picture. A firm that has spent three years answering every question its clients ask has built a competitive moat that a newcomer cannot cross with a larger ad budget. The newcomer can outbid you for a keyword tomorrow. It cannot publish three years of indexed expertise by Friday.
None of this happens by accident. Compounding requires content systems that turn an advisor’s expertise into a steady flow of reviewed, compliance-aware pages without consuming the advisor’s week. The advisor supplies the knowledge, and the system handles structure, publishing, and internal linking so each new page strengthens the ones before it.
There is a compliance angle as well. Ad copy is short, usually needs fresh review every time a headline changes, and disappears when the campaign ends. A reviewed educational page goes through approval once and then keeps working, so compliance effort goes into an asset instead of a rotating set of headlines — one more line in the financial services content infrastructure vs ads ledger that rarely gets counted.
Not sure where your firm stands on financial services content infrastructure vs ads spending? The assessment shows where your visibility gaps are and what to build first.
Lender SEO vs Paid Ads Long Term: Cost Per Funded Loan
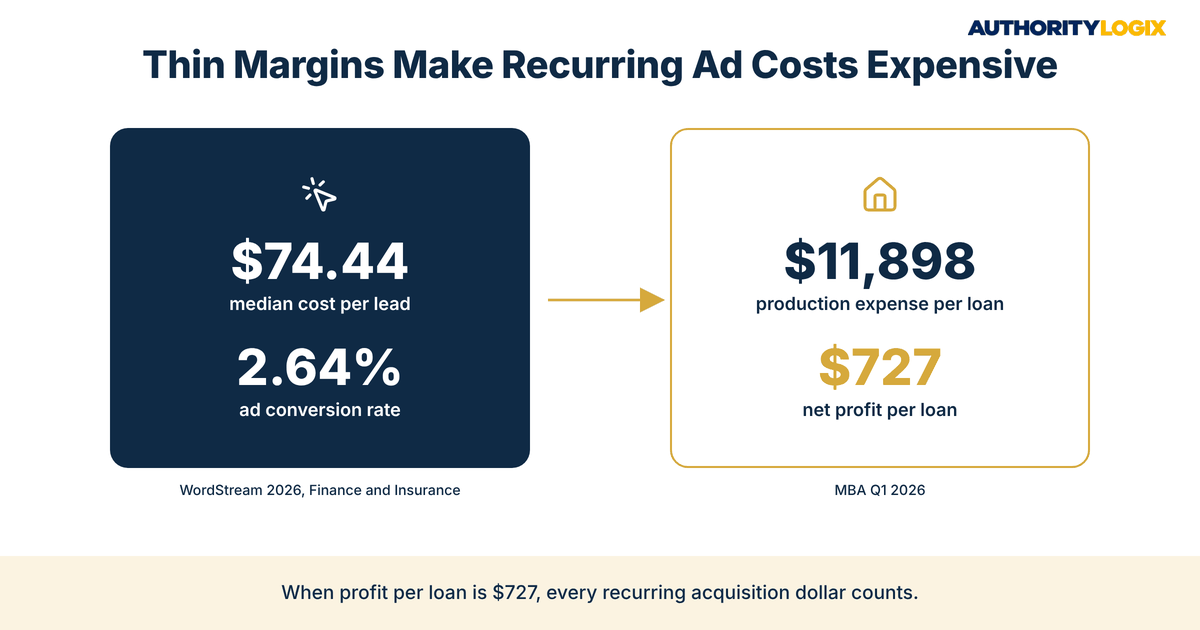
Lender SEO vs paid ads long term is where financial services content infrastructure vs ads gets measured in dollars, and the number that matters is marketing cost per funded loan. A lead is not a loan. With Finance and Insurance converting ad clicks at 2.64% in WordStream’s 2026 benchmarks — the lowest of any industry tracked — and a median cost per lead of $74.44, the real cost climbs quickly once you count leads that never apply, never qualify, or never close.
The Mortgage Bankers Association’s first-quarter 2026 performance data shows why that matters. Independent mortgage banks reported total loan production expenses of $11,898 per loan against a net production profit of $727 per loan. On margins that thin, every acquisition dollar that recurs month after month comes straight out of the profit on each funded loan, and financial services content infrastructure vs ads stops being a marketing debate and becomes a margin question.
Financial Services Content Infrastructure vs Ads on a Cost-Per-Loan Basis
| Factor | Paid Search | Content Infrastructure |
|---|---|---|
| Cost model | Paid per click, on every click | Paid up front per page, then maintenance |
| Benchmark | $74.44 median cost per lead, Finance and Insurance (WordStream 2026) | 748% three-year SEO return (First Page Sage) |
| Breakeven | About 4 months | About 9 months |
| When spending stops | Inquiries stop | Indexed pages keep ranking |
| Trust signal | Labeled as sponsored | Educational expertise on your own domain |
| Position at month 36 | Same cost per lead, no asset | Growing library, falling cost per inquiry |
The table does not make ads useless; it makes them a cost rather than an asset. The search framework behind the right-hand column — keyword mapping, page architecture, local signals — is laid out in the SEO playbook, and it is built so each new page is cheaper to rank than the last.
Quality decides whether the right-hand column works at all. Thin, generic pages do not rank in a category Google treats as high-stakes, so the finance content has to be written with genuine lending knowledge, accurate figures, and clear authorship. Generic copy is just another expense with a slower payoff.
Where Paid Ads Still Fit Inside an Infrastructure Plan
The point of financial services content infrastructure vs ads is not to ban ads. It is to give them a narrower job. Ads are useful in four situations:
- Message testing: a small budget shows which headlines and offers earn clicks before full pages are written around them.
- Program launches: ads cover the months before a new loan program page earns its rankings.
- Retargeting: ads reach readers who visited educational pages and left without making contact.
- Local gaps: ads support markets where your pages are still building position.
Well-run firms treat ad spend as a bridge to the content system, not a substitute for it. Every ad points to a page worth reading without the ad, so the click lands on an asset that keeps working after the campaign ends. That is how financial services content infrastructure vs ads becomes a partnership instead of a contest.
Distribution closes the loop. Syndication, earned media, and authority distribution put your published expertise in front of audiences who would never see a sponsored result, and each placement sends trust signals back to your own domain. Paid reach ends with the invoice, while earned reach keeps pointing to you.
BKDSCR.com, the AuthorityLogix proof-of-concept in the NYC outer-borough DSCR niche, was built with zero paid ads. In under 18 months it reached 18 pillar pages, 7 interactive investor tools, and 48 SEO-optimized blog posts, and it generates inbound leads organically. That build is the working version of everything this article describes.
What Firms Get Wrong About Financial Services Content Infrastructure vs Ads
Most firms that compare financial services content infrastructure vs ads make the comparison on the wrong terms. These are the mistakes and questions that come up most often.
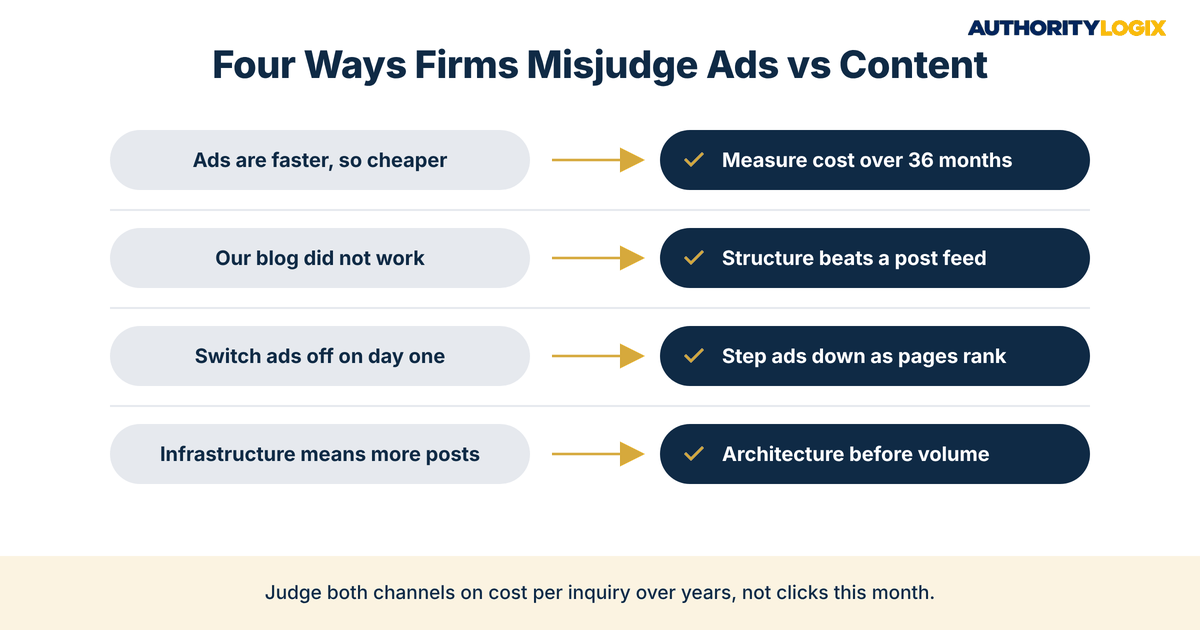
Wrong: “Ads are faster, so they are cheaper.”
In financial services content infrastructure vs ads comparisons, faster and cheaper are different measurements. Ads produce the first inquiry sooner; infrastructure produces the hundredth inquiry at a lower cost. On a 36-month view, a channel returning 36% rarely beats a channel returning 748%, even after the slower start.
Wrong: “We tried a blog and it did not work.”
A blog with no structure, no internal links, and no capture points is not infrastructure. It is a set of disconnected posts, and disconnected posts fade. Content produces inquiries when it is wired into lead generation — checklists, calculators, and next-step offers that turn a reader into a conversation.
Question: “How long before content can replace ad spend?”
First Page Sage’s research puts typical SEO breakeven near nine months, so a sensible planning assumption is a 12- to 18-month overlap in which both channels run. The financial services content infrastructure vs ads transition is gradual: ad budgets step down as organic inquiries rise, rather than switching off on a fixed date.
Question: “Can a smaller firm afford to build both?”
Few firms can fund a full infrastructure build and heavy ad spend at once, which is why sequencing matters. Mapping where current spend goes and which pages would replace it is what we do at the start of an engagement. The answer is usually a smaller, targeted ad budget alongside a steady build.
Wrong: “Infrastructure just means publishing more.”
Volume is not the variable. A firm can publish daily and stay invisible if the pages are not organized around real borrower and client questions, reviewed for accuracy, and linked into a library. The order matters more than the count, and how we build follows the same sequence every time: architecture first, pages second, distribution third.
Want lead flow that keeps building after the ad budget stops? We’ll build the content infrastructure that lowers your cost per loan over time.
Infrastructure Compounds. Ads Stop. What That Means for Your Firm
The honest read on financial services content infrastructure vs ads is that most firms are not choosing between two equal options. They are choosing between paying for attention every month and building a lead system that keeps producing inquiries after the build is done. The first is easier to start. The second is the one still working three years from now.
Nothing here guarantees a specific number of leads, and no honest consultant would promise one. What the financial services content infrastructure vs ads data does show is direction: paid search costs rise with competition, while organized, indexed expertise gets cheaper per inquiry the longer it exists. The evidence for why it works is a live platform, not a projection.
The honest answer is that most lenders and advisors already have the expertise. The missing piece is the infrastructure that makes the market see it, and if you want that built, the conversation starts when you work with us. You stay the subject matter expert; the system is what gets built around you.