

Key Takeaways
- The financial services growth metrics that predict long-term health measure what compounds — retention, referral validation, organic inquiry share, and cost per funded loan or new client — not raw lead counts.
- MBA’s 2025 Annual Mortgage Bankers Performance Report put production expense at $11,094 per loan against an average net production profit of $785, so small swings in acquisition cost decide whether a loan earns money.
- The 2024 Kitces Report found the median advisory practice spent $3,800 to win one new client in 2023, up 75% since 2021, while organic new-client revenue growth slipped to 8.6%.
- Leading indicators such as branded search, return visitors, and inquiries that cite your content show business health months before revenue does.
- A monthly review of six to eight financial services growth metrics beats a dashboard of forty, because each number has an owner and a decision attached.
- Vanity numbers hide problems. Firms that measure infrastructure instead of activity see the gap while it is still cheap to close.
Table of Contents

Why Financial Services Growth Metrics Matter More Than Lead Counts
Financial services growth metrics are supposed to tell you whether your firm is getting stronger, yet most lenders and advisors still judge the month by one number — how many leads came in. That number feels concrete. It is also the least predictive figure on the report, because a lead says nothing about what it cost, whether it closed, or whether the client stays.
If you have been in this business for 15 years, you already know which clients built the firm and which ones cost it money. Their financial services growth metrics rarely show it. Firms that hold long-term rankings for the questions their borrowers and clients ask build a different kind of pipeline — one where inquiries arrive pre-qualified by the content they read, and where the cost of the next client falls instead of rising.
The math is unforgiving in mortgage. MBA’s 2025 Annual Mortgage Bankers Performance Report found that independent mortgage banks spent an average of $11,094 to produce each loan while earning an average net production profit of $785 per loan. When the margin is that thin, a lender tracking lead volume alone can grow its pipeline and shrink its profit in the same quarter.
Advisors face the same squeeze from a different direction. The 2024 Kitces Report marketing study found that the median practice spent $3,800 to acquire one new client, and that almost two-thirds of clients found their advisor through a referral. Principles from the authority guide explain why that dependence is a ceiling: referred prospects still search your name before they call, and what they find decides whether the referral converts.
The financial services growth metrics that matter answer three questions. Is the firm becoming easier to find? Is it becoming cheaper to win a client? Is it keeping the clients it wins? Every system described on the services hub maps to one of those questions, which is why measurement has to be designed into the build rather than bolted on later.
The Financial Services Growth Playbook shows how lenders, advisors, and firms build authority that keeps growing, and which financial services growth metrics show whether the build is working.
Leading Indicators: Mortgage Company KPIs Authority Builders Watch First
Revenue is the slowest of all financial services growth metrics. By the time funded volume drops, the cause is usually months old — a competitor took the top search position, a review profile went stale, or referral partners kept sending borrowers who searched and found someone else first.
The mortgage company KPIs authority-focused lenders watch are the ones that move first. Branded search volume shows whether more people are looking for you by name. Return visitors show whether your educational content earns a second look, and the share of inquiries that arrive as organic leads rather than purchased ones shows whether your pipeline is something you own or something you rent.
Financial Services Growth Metrics That Lead Revenue
Five leading indicators carry most of the predictive weight among financial services growth metrics for lenders. Here is what each one predicts and where to find it.
| Leading Indicator | What It Predicts | Where to Find It |
|---|---|---|
| Branded search impressions | Whether referrals and past clients are looking you up | Google Search Console |
| Return visitor rate | Whether educational content earns trust over time | Website analytics |
| Organic share of new inquiries | A pipeline you own versus one you rent | CRM lead source field |
| Inquiries that cite a specific article | Content doing pre-qualification work | Intake notes |
| Review velocity | Trust signals at the decision stage | Google Business Profile |
None of these financial services growth metrics require new software. They require the discipline to record lead source accurately and to look at the same numbers every month. Firms that win here usually build an educational hub first, because a structured library of answers gives every leading indicator something to measure.
There is a retention signal hiding in this data as well. ICE’s Mortgage Monitor reported that servicers retained 32% of refinancing borrowers in the first quarter of 2026, down from 35% the quarter before — so roughly two out of three refinancing borrowers went elsewhere. A past borrower who never hears from you between closings is a borrower your competitor’s content is educating.

Advisor Business Health Metrics That Predict Retention and Growth
For advisory firms, advisor business health metrics start with the client base you already have. Retention across the industry is high, which is exactly why it is a weak entry among financial services growth metrics on its own. A firm can keep nearly every client and still shrink in real terms if new relationships stop arriving.
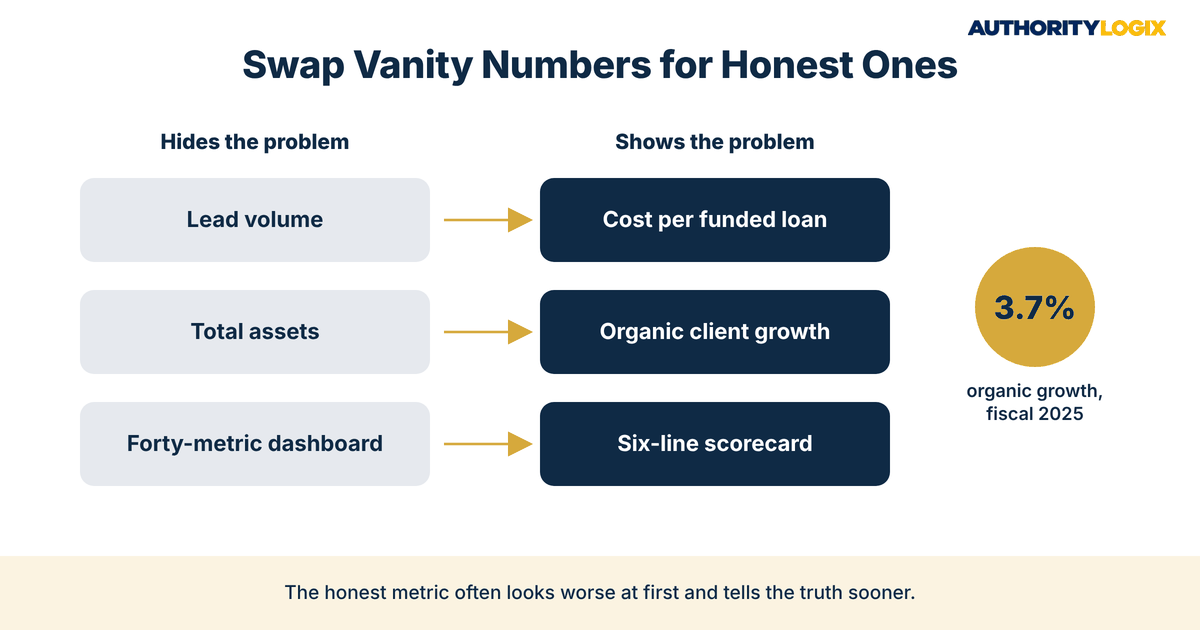
The 2026 data makes the point. The Ensemble Practice’s 2026 True Ensemble Growth and Profitability study, as reported by InvestmentNews, found that organic growth from new client relationships was 3.7% in 2025, near the lowest level in its decade of benchmarking. The Paithos RIA Signals Report found that nearly a third of firms grew assets without adding any reported clients — market returns did the work, and market returns are not a growth system.
Schwab’s RIA Benchmarking Study research shows what separates the leaders. In Schwab’s 2026 RIA Benchmarking Study, top-performing firms grew net asset flows 15.3% versus 4.7% for all other firms, and 52% of them had a documented referral plan for existing clients. A documented plan turns financial services growth metrics into a habit: someone owns the number, and the number gets reviewed.
Four Advisor Business Health Metrics Worth a Monthly Look
- New client relationships as a share of total clients, tracked separately from asset growth.
- Referral-to-meeting rate — the share of referred prospects who book a first conversation after looking you up.
- Client acquisition cost by channel, including staff and advisor time.
- Share of new clients who cite your articles, a webinar, or a search result as part of their decision.
That last line is where authority shows up in the numbers. When prospects arrive already familiar with your thinking, the first meeting starts further along and fee conversations get easier, which is the practical meaning of a competitive moat in an advisory market.
The Kitces data points the same direction. In the 2024 Kitces Report, online directory listings carried the lowest tactic-level acquisition cost at $634 per client, and client referrals and centers of influence were the only other tactics to score above 1.0 on its efficiency measure. Firms that build content systems around those channels give referred and directory prospects something substantive to read before the first meeting.
Lender Marketing Performance Indicators Tied to Funded Loans
The lender marketing performance indicators that matter end at a funded loan, not at a form fill. A lead that never reaches application is a cost, and a lead that reaches application but falls out in underwriting is a larger one. Adding cost per funded loan by source to your financial services growth metrics is the change that tends to reorder a lender’s budget fastest.
This is not a mortgage-only problem. Research published by Demand Gen Report found that only 29% of teams in its 2025 Demand Generation Benchmark Survey run a fully integrated approach to brand and demand marketing, which means most teams measure the two separately and never see how visibility feeds pipeline. Lenders fall into the same split when search, referrals, and paid leads report to different spreadsheets.
The fix starts with one funnel view of financial services growth metrics, from first visit to funded loan, broken out by source. Attribution is where most lenders lose the thread, and the SEO playbook covers how to credit organic search correctly, which matters because organic borrowers often visit several times before they apply and get misattributed to the last click.
Content earns its place in this view when it shortens the path. A loan program page that answers what a DSCR or FHA borrower actually asks — documentation, timelines, qualification ranges — produces inquiries from people who already understand the product, and that shows up later as a stronger inquiry-to-application rate in your own data. That is the job of finance content written for a regulated audience.
Not sure which of your financial services growth metrics are telling the truth? The FS Authority Gap Assessment shows where your visibility infrastructure is weak and which numbers to fix first.
Building a Monthly Review of Financial Services Growth Metrics
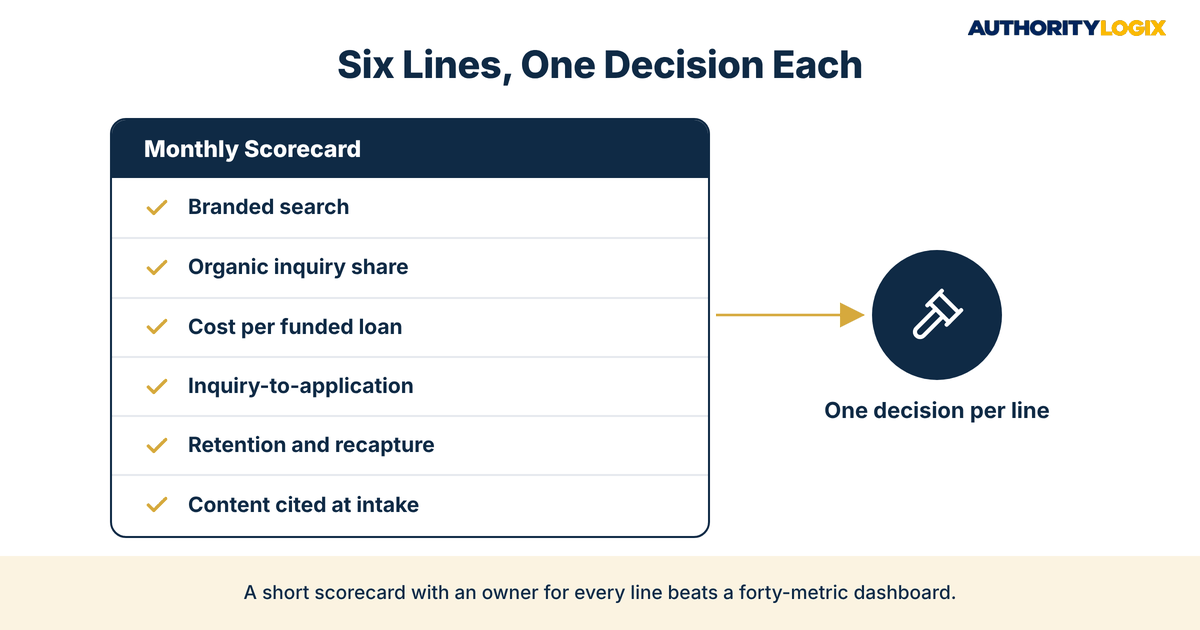
A metric nobody reviews is decoration. The firms that use financial services growth metrics well hold a short monthly review — thirty to forty-five minutes, the same numbers every time, with one decision recorded per number.
The Financial Services Growth Metrics Scorecard
Keep the scorecard to six to eight lines. More than that and the review turns into a reading exercise instead of a decision meeting, so a workable version for lenders and advisors looks like this.
| Scorecard Line | The Question It Answers | The Decision It Triggers |
|---|---|---|
| Branded search impressions | Are more people looking us up by name? | Adjust referral partner follow-up and review requests |
| Organic share of new inquiries | Do we own more of our pipeline this month? | Shift budget between paid and owned channels |
| Cost per funded loan or new client, by source | Which channels earn their cost? | Cut or expand a channel |
| Inquiry-to-application or inquiry-to-meeting rate | Are the right people arriving? | Revise the pages that feed weak sources |
| Retention and recapture | Are past clients coming back and referring? | Change post-close or annual review communication |
| Content cited at intake | Is the library doing pre-qualification work? | Commission the next topic cluster |
A scorecard of financial services growth metrics only works if the publishing side is organized to respond to it. When a metric moves, someone needs to know which page, article, or listing to change, and that only happens inside a documented content system where each asset has a defined job.
Distribution belongs on the scorecard too. Citations, syndicated articles, and mentions on third-party sites are what move branded search and referral validation over time, and authority distribution is the layer most firms never measure because it does not produce a lead on the day it publishes. Track mentions and referring domains quarterly, even if the rest of the review is monthly.
Metric Mistakes That Hide Problems — and the Questions Firm Owners Ask
Most failures with financial services growth metrics are not about missing data. They come from tracking numbers that look good while the underlying business weakens, and the same handful show up in lender and advisor reporting again and again.
Mistake: Treating lead volume as the growth number
Volume rises easily when you buy more of it, and purchased leads rarely build anything that lasts past the invoice. A lead generation system built on owned channels often reports fewer, better inquiries — which can look worse on a volume chart while cost per funded loan falls. Judge the month on the second of those financial services growth metrics.
Mistake: Reporting assets or volume without separating market lift
When markets rise, assets under management rise with them, and when rates fall, refinance volume climbs regardless of marketing. Separate organic growth from market lift before you credit any system. The 3.7% organic growth figure above shows how much market movement can hide.
How many financial services growth metrics should a small firm track?
Six to eight on the monthly scorecard is enough for most independent lenders and advisory practices. Track more in the background if your tools collect them, but review only the ones attached to a decision. Cutting the report down to numbers that predict something is part of what we do at the start of every engagement.
Which metrics move first after a build begins?
Branded search and return visitors usually respond first, followed by inquiry mix, then cost per funded loan or new client. Timing depends on your market and starting point, so set a baseline before anything changes.
Do these metrics raise compliance questions?
The metrics themselves are internal marketing measures rather than client communications, so measurement is rarely where compliance questions arise. The content that moves them still has to clear your review process, and our page on how we build shows where that review sits in the publishing sequence.
Want to track the growth numbers that actually matter? We’ll set up the metrics and build the system that moves them.
Measure What Compounds: The Financial Services Growth Metrics Worth Keeping
Financial services growth metrics are only as useful as the infrastructure underneath them. A lender with no educational content has no leading indicators to watch, and an advisor whose prospects find nothing substantive online has no way to measure trust before the first meeting. Measurement and the build arrive together, which is why a well-designed lead system treats tracking as part of the architecture rather than a reporting afterthought.
BKDSCR.com, the AuthorityLogix proof-of-concept in the NYC outer-borough DSCR niche, was built with 18 pillar pages, 7 investor tools, and 48 blog posts, and it generates inbound leads with zero paid ads. That build is the clearest explanation of why it works: the measurement points at the infrastructure, and the infrastructure is what moves the numbers.
The firms whose financial services growth metrics improve year after year are rarely the ones spending the most. They are the ones whose content, listings, and reputation keep working after the month closes — infrastructure compounds. Ads stop.
The honest answer is that most lenders and advisors already have the expertise and the client results that should make growth predictable. What they lack is a short set of financial services growth metrics that shows whether the market can see it, and a system that moves those numbers on purpose. If you want both built properly, you can work with us to map the gaps first.