


Key Takeaways
- Physical therapy marketing budget allocation decides more about new-patient flow than the size of the budget, because each channel either stops when spending stops or keeps working afterward.
- Gartner’s June 2026 marketing survey found awareness and conversion account for 62.6% of total media spend and digital media makes up more than two-thirds of media investment — a large-enterprise, cross-industry view, not a PT benchmark.
- WordStream’s 2026 benchmarks put Physicians & Surgeons search campaigns at a $40.04 cost per lead, the closest healthcare reference point for a PT practice weighing paid search.
- Physical therapy ROI by marketing channel should be measured in booked evaluations, not clicks, calls or impressions.
- BrightLocal’s 2026 survey found 74% of consumers look for reviews written in the last three months, which makes review flow a budget line, not an afterthought.
- A sound physical therapy marketing budget allocation moves money from rented channels toward owned assets — condition pages, the Business Profile and content — as those assets mature.
Table of Contents

Physical therapy marketing budget allocation is the decision most practice owners make by habit rather than by plan. The money goes where it went last year — a directory listing, a few months of ads, a sponsorship, a mailer — and nobody can say which line produced the evaluations on the schedule. Before adding a dollar, it helps to know your real acquisition cost by channel, because the channel that looks cheapest per click is rarely the one that is cheapest per patient.
That is the credible but invisible pattern in budget form. The clinical team is strong, the reputation with local physicians is real, and yet the practice spends money on visibility that disappears the moment the invoice stops. This article lays out a physical therapy marketing budget allocation built around evaluation bookings and owned assets.
Why Physical Therapy Marketing Budget Allocation Matters More Than Budget Size
Two practices can spend the same amount and end the year in very different places. One spends it all on channels that rent attention — ads, paid listings, sponsorships — and starts every January from zero. The other moves part of the same budget into condition pages, a complete Business Profile, reviews and patient education, and starts the next year with assets that are still producing calls. Physical therapy marketing budget allocation is the difference between those two outcomes.
Referral dependence makes the stakes higher. If a handful of physicians send most of your new patients, one referring doctor retires and the pipeline dries up overnight. A budget built only around physician relations protects that one channel while leaving the practice exposed everywhere else.
Direct access widens the opportunity. APTA reported in June 2025 that patients in all 50 states, the District of Columbia and the U.S. Virgin Islands have either provisional or unrestricted direct access to physical therapist services. That makes searching patients a channel your physical therapy marketing budget allocation should fund on purpose, not by accident.
The growth blueprint frames marketing spend as an investment in authority infrastructure, where each owned asset adds to the next rather than resetting every quarter. That framing changes physical therapy marketing budget allocation from an expense review into a build plan.
The Physical Therapy Patient Acquisition Playbook maps every patient channel a practice can fund, so your physical therapy marketing budget allocation follows a full pipeline instead of last year’s invoices.
PT Marketing Spend by Channel: Where Independent Practices Put Money Today
Most independent practices spread PT marketing spend by channel across the same short list: physician relations, paid search, directory and insurance listings, community events, print, social posts and the website. The question that matters is which line produced which evaluation. The table below groups those channels by what happens when the spending stops, which is the most useful single question in physical therapy marketing budget allocation.
| Channel | What the Money Buys | When Spending Stops |
|---|---|---|
| Paid search | Placement above the results for chosen searches | Visibility stops the same day |
| Paid directories and listings | A spot on a third-party site | The listing drops or disappears |
| Print, mailers and sponsorships | Short-term local awareness | Little lasting search value remains |
| Physician relations | Referral relationships | Relationships fade without contact |
| Condition pages and patient education | Owned pages that rank for patient searches | Pages keep ranking and converting |
| Business Profile and reviews | Map pack visibility and trust | Recent reviews keep building trust |
The broader marketing world is already moving toward measurable channels. Gartner’s June 2026 marketing survey found that awareness and conversion now account for 62.6% of total media spend, and that digital media makes up more than two-thirds of total media investments in 2026, up 18% since 2024. Gartner surveyed 401 marketing leaders, the vast majority at companies with more than $1 billion in revenue, so treat this as cross-industry context rather than a PT benchmark.
The same Gartner survey found spending on customer loyalty and retention declined 29% since 2024 to less than 15% of total media spend. For a PT practice, that is a warning, not a model. Former patients already know the clinic and cost little to reach through reactivation outreach, so a physical therapy marketing budget allocation that ignores them follows the wrong trend.
Every practice has its own mix of locations, payers and specialties, which is why the PT industry hub treats PT visibility as a set of connected systems rather than a single campaign. The right physical therapy marketing budget allocation depends on which channels your patients actually use to find you, and that answer comes from tracking, not from a template.
Allocating across channels also requires someone to own the plan. Clinic directors rarely have time to compare channel reports each month. Building and measuring the full mix is a core part of what we do for PT practices, so the budget follows results instead of sales pitches.

Measuring Physical Therapy ROI by Marketing Channel With Evaluation Bookings
Physical therapy ROI by marketing channel only means something when every channel is measured against the same outcome. Clicks, impressions and calls are activity. The outcome that pays the practice is a booked and attended evaluation, and the lead generation systems behind a PT site exist to capture and count those bookings by source.
Tracking Cost per Booked Evaluation by Channel
The calculation is simple once intake asks every new patient how they found the practice and the website records which page each booking came from. Divide what each line of your physical therapy marketing budget allocation cost in a month by the evaluations it produced. As a hypothetical example, a channel that costs $1,200 a month and books 10 evaluations costs $120 per evaluation, while one that costs $600 and books 2 costs $300.
| Metric | What It Tells You | Where It Comes From |
|---|---|---|
| Cost per booked evaluation | The true price of a new patient by channel | Channel cost divided by evaluations booked |
| Show rate | Whether a channel brings committed patients | Scheduling system |
| Visits per plan of care | Whether patients from a channel complete care | Practice management reports |
| Share of direct-access patients | How independent the practice is from referrals | Intake source question |
| Owned-asset bookings | How much the practice owns versus rents | Website and Business Profile tracking |
Paid search is the easiest channel to benchmark against public data. WordStream’s 2026 Google Ads benchmarks, drawn from 13,474 U.S. search campaigns, put the Physicians & Surgeons category at a $4.76 cost per click and a $40.04 cost per lead, against $66.69 per lead across all industries. A lead is not an evaluation, so a PT practice should convert those figures into its own cost per booked evaluation before comparing physical therapy ROI by marketing channel.
Owned assets are harder to value in the first month and easier to value in the second year. Each condition page, review and published article adds to an authority flywheel in which visibility produces patients, patients produce reviews, and reviews lift visibility again. Measured over a full year, that compounding is why owned assets usually earn a growing share of a physical therapy marketing budget allocation.
Not sure which of your channels produce evaluations and which only produce invoices? The PT Authority Gap Assessment shows where your physical therapy marketing budget allocation is leaking and which owned assets to build first.
PT Budget Digital Marketing: Map Pack, Condition Pages and Content
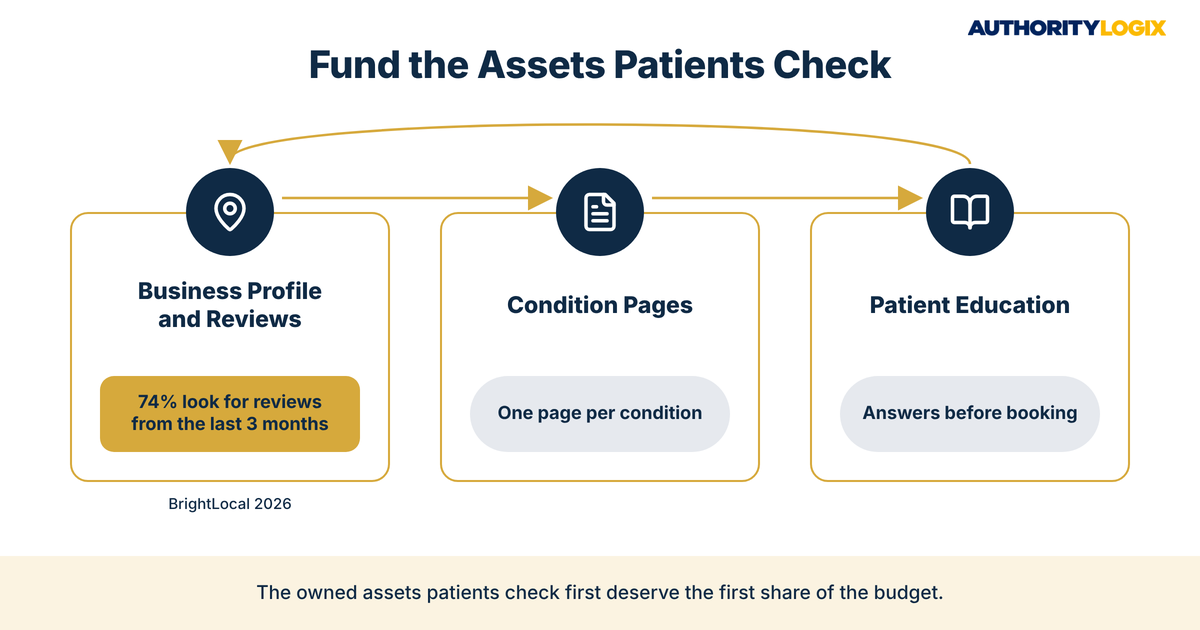
The PT budget digital marketing line usually gets split among ads, a website retainer and social posting, with little left for the assets patients actually check. In any physical therapy marketing budget allocation, three owned assets deserve funding first: the Business Profile and reviews, condition pages, and patient education content. Each one supports the others, and each keeps working after the work is done.
The map pack is where a searching patient first compares clinics side by side. The local visibility guide covers the Business Profile, location page and citation work that earns a place there, and it is usually the first owned asset a physical therapy marketing budget allocation should fund.
What Patients Check Before Booking
Reviews are now a recency game. BrightLocal’s 2026 Local Consumer Review Survey of 1,002 U.S. adults found that 74% of consumers look for reviews written in the last three months, and that 80% say they are likely to use a business that responds to all of its reviews. The same survey found 31% will only use a business rated 4.5 stars or higher, up from 17% the year before.
Those findings turn review requests and owner replies into a standing line in the physical therapy marketing budget allocation. A steady monthly review flow, managed as part of the practice’s local search system, does more for map pack trust than a one-time push. It also feeds the condition pages and Business Profile that patients compare.
Condition pages and educational content carry the organic side of the PT budget digital marketing plan. A page that explains how physical therapy approaches a specific condition, names the clinicians who treat it and shows how to book answers the searching patient directly. The content SEO playbook covers how those pages are planned, structured and linked so they rank together instead of competing with one another.
A Physical Therapy Marketing Budget Allocation Framework for Direct-Access Growth
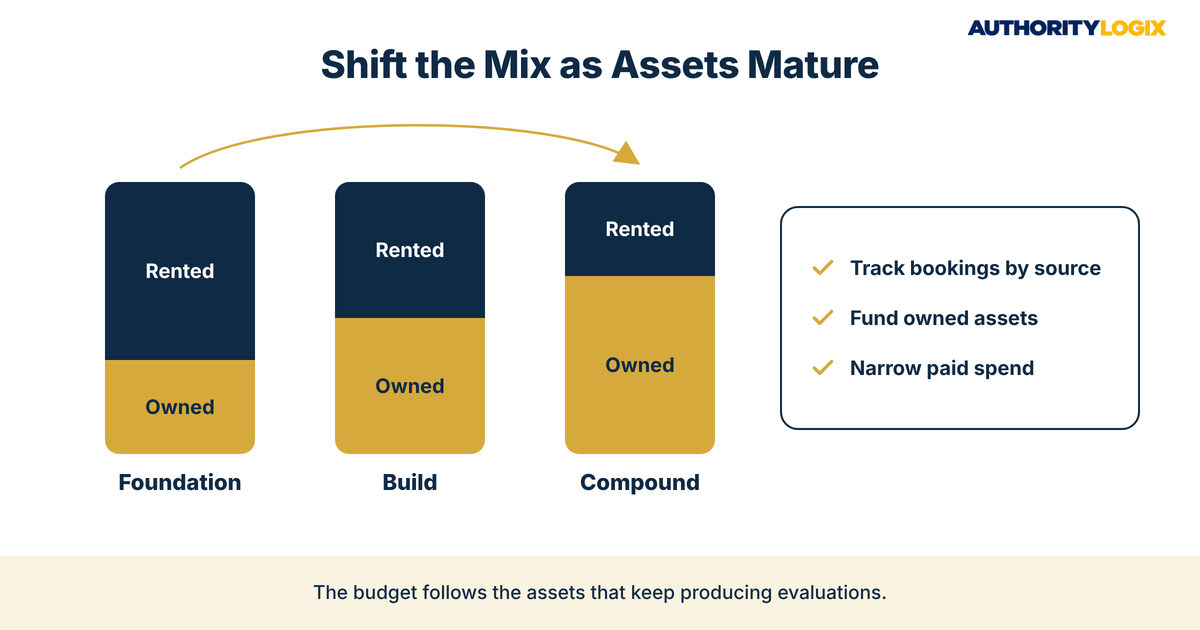
A useful framework shifts the mix over time instead of fixing it once. In the early months, rented channels such as paid search fill the schedule while owned assets are built. As condition pages start ranking and reviews accumulate, the budget moves toward the assets that keep producing evaluations, and paid spend narrows to the conditions and locations where organic visibility is still thin.
Setting Physical Therapy Marketing Budget Allocation by Practice Stage
| Practice Stage | Where Most of the Budget Goes | What to Measure |
|---|---|---|
| Foundation | Business Profile, review flow, core condition pages, intake tracking | Evaluations booked by source |
| Build | Condition page library, patient education, targeted paid search | Cost per booked evaluation by channel |
| Compound | Content expansion, authority distribution, reactivation | Share of evaluations from owned assets |
| Multi-location | Location pages and profiles for each clinic | Evaluations and reviews per location |
Owned assets need production capacity, not just a budget line. Practices that publish through content systems get a steady flow of condition pages and educational articles without pulling clinicians away from patients for weeks at a time.
As the library grows, structure matters more than volume. An educational hub organizes condition pages and articles so each one supports the others, which is how a physical therapy marketing budget allocation built around content keeps its value instead of producing a pile of disconnected posts.
The Compound stage adds reach. Placing the practice’s expertise in local publications, directories and partner sites through authority distribution extends visibility beyond the website and the map pack. At that point, physical therapy marketing budget allocation becomes a question of where the next owned asset will do the most work.
What Most PT Practices Get Wrong About Marketing Budgets (and What Patients Actually Notice)
Most physical therapy marketing budget allocation mistakes come from judging channels by activity instead of bookings. These are the questions practice owners ask, along with what a searching patient actually notices.
Should we cut marketing when the schedule is full?
A full schedule is the best time to shift physical therapy marketing budget allocation toward owned assets, because there is no pressure to buy immediate bookings. Cutting everything when the calendar is busy means starting from zero when a referral source slows down.
Do patients notice the difference between an ad and a ranking?
Patients notice whether a clinic looks established and specific to their problem. Credentials, condition pages and recent reviews — the trust signals covered in the clinical authority guide — matter more to a searching patient than where the listing sits on the page.
Is social media worth a large share of the budget?
Social posts can support visibility, but they rarely rank for the searches patients run when they need care. In a physical therapy marketing budget allocation, fund the assets patients check first, then add social distribution once the condition pages and Business Profile are in place.
How much should we spend in total?
There is no PT-specific benchmark we can point to with confidence, and a total without a plan tends to repeat last year’s mix. Start with the evaluations you need, measure what each channel produces, and fund the owned assets that make the next year cheaper. The PT resource library covers each of those owned channels in detail.
Want a physical therapy marketing budget allocation built around booked evaluations and owned assets instead of renewing last year’s invoices? Let’s build the system that moves your spend toward owned assets.
The Honest Close: Budget Follows Strategy, Not the Other Way Around
Physical therapy marketing budget allocation is a strategy written in dollars. If the strategy is to rent visibility, the budget will need to grow every year just to stand still. If the strategy is to build owned assets and measure every channel by booked evaluations, the same budget buys more each year.
The order of the work matters, and the sequence in how we build starts with the assets patients check first before expanding into content and distribution. AuthorityLogix proved that owned-asset model on BKDSCR.com, its own proof-of-concept build in the NYC DSCR real estate niche, with 18 pillar pages, 7 interactive investor tools and 48 SEO-optimized blog posts generating inbound leads with zero paid ads.
That proof is a big part of why AuthorityLogix approaches PT budgets the way it does. The honest answer is that most PT practices already have the clinical expertise patients are searching for. What is missing is a physical therapy marketing budget allocation that funds the infrastructure to make the market see it.