


Key Takeaways
- The physical therapy practice benchmarks market leaders track are mostly local and comparative: map pack position, review volume and recency, condition page coverage, and evaluation bookings by source.
- Well-documented industry averages for PT marketing performance are scarce, so the most reliable comparison is your own numbers against the top three practices in your market.
- Credible benchmarks do exist for some questions: APTA’s 2024 report puts the outpatient physical therapy vacancy rate at 9.5%, nearly double the 4.8% all-industry average.
- Google says local results are mainly based on relevance, distance, and prominence, and that more reviews and positive ratings can help local ranking.
- A PT competitive benchmark analysis should compare condition pages and visible clinician credentials, not just rankings.
- The physical therapy practice benchmarks market leaders rely on only become useful when they connect to targets you set for your own pipeline.
Table of Contents

How to Read Physical Therapy Practice Benchmarks Market Leaders Actually Track
The physical therapy practice benchmarks market leaders actually track look very different from the national averages that circulate in marketing decks. Practices that lead a local market usually measure a short list of things they can see and change: where they appear for the conditions they treat, how many patients book evaluations without a physician referral, and how their reviews and clinician pages compare with the practice down the street. That local, comparative view is where the PT industry hub starts with every practice, because the competition a patient sees is never national.
Owners often ask for a single number that says whether their marketing is working. No honest single number exists. What exists is a set of physical therapy practice benchmarks market leaders use together, covering visibility, conversion, and cost, each read against the same few local competitors over time. Reading the physical therapy practice benchmarks market leaders use as a set keeps one good month from hiding a weak channel.
Cost measures are the ones owners watch most closely and often read least carefully. Your patient acquisition cost only means something next to the value of the patient and the channel that produced them, which is why it should be tracked by source instead of as one blended figure. A channel that costs more per patient may still be the better investment if those patients are worth more to the practice over time.
Three Types of Physical Therapy Practice Benchmarks Market Leaders Use
| Benchmark Type | Example Measures | Compare Against |
|---|---|---|
| Visibility | Map pack position for condition and near-me searches, review count and recency, condition page rankings | The top three practices in your local results |
| Conversion | Website visits to evaluation requests, calls answered, evaluation bookings by source | Your own trailing twelve months |
| Cost | Acquisition cost by channel, share of new patients from direct access versus physician referral | Your own history and the targets you set |
| Authority | Condition page coverage, visible clinician credentials, mentions on other sites | The same top three local competitors |
None of these measures needs a national average to be useful. They need consistent tracking, which is where most practices fall down, and setting that tracking up as part of the visibility system is part of what we do for PT practices. The physical therapy practice benchmarks market leaders track in that table are all things you can count yourself. Without a baseline, every later result is a guess.
The Physical Therapy Practice Authority & Growth Blueprint lays out the authority and positioning system these benchmarks measure, so every number connects to something you can build.
PT Marketing Performance Benchmarks for Evaluation Bookings and the Patient Pipeline
PT marketing performance benchmarks start where revenue starts: the evaluation booking. Everything upstream, from search visibility to reviews to the website, exists to produce booked evaluations, and everything downstream depends on them. A practice that tracks rankings but not evaluations by source is measuring activity instead of results. Among all the physical therapy practice benchmarks market leaders watch, evaluation bookings by source sit closest to revenue.
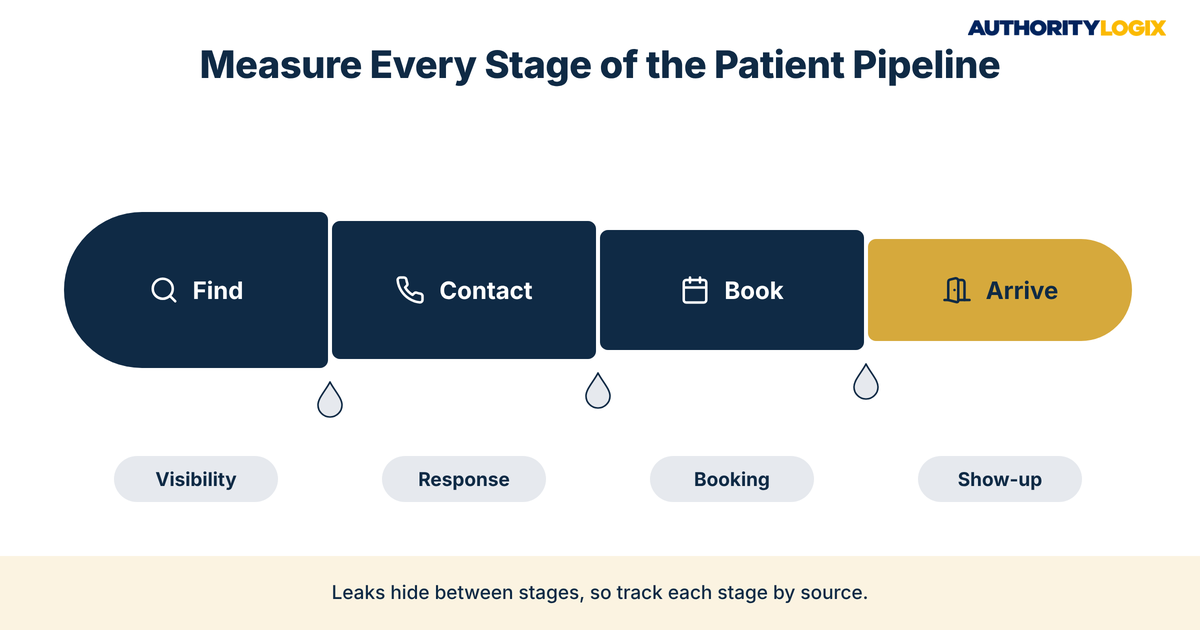
The pipeline has four stages worth measuring separately: patients who find you, patients who contact you, patients who book, and patients who arrive. Leaks show up between the stages, and lead generation systems are built around closing them, from call handling to online scheduling. Market leaders tend to know their numbers at each stage, while many practices only know the last one.
- New evaluation requests by source: search, physician referral, review sites, and returning patients
- Share of new patients who arrived through direct access
- Calls and form requests answered the same business day
- Requests that became booked evaluations
- Booked evaluations that arrived for the first visit
A long dashboard is easy to abandon, and the physical therapy practice benchmarks market leaders keep are short enough to review in one monthly meeting. Five pipeline measures reviewed every month tell you more than thirty reviewed once.
Tracking by source exposes dependence before it becomes a crisis. One referring doctor retires and the pipeline dries up overnight, and a practice that measures its referral share sees that risk long before it lands. The acquisition playbook covers how to build the direct-access channels that change those percentages, which makes it the natural partner to these physical therapy practice benchmarks market leaders watch.
Map Pack, Reviews, and Local Visibility Measures Worth Comparing
Local visibility is the easiest area to benchmark against competitors, because the results are public. Google’s Business Profile help documentation says local results are mainly based on relevance, distance, and prominence, which it describes as how well-known a business is, and it states that more reviews and positive ratings can help a business’s local ranking. Those factors tell you what to compare, and every local measure among the physical therapy practice benchmarks market leaders compare maps back to one of them.
Start with the searches patients actually run: the conditions you treat plus your town, and near-me searches from the neighborhoods you serve. Record where you appear in the map pack for each one, and repeat the check monthly from the same locations. Results shift with the searcher’s location, so local search benchmarks need a fixed set of queries and places to mean anything.
| Local Measure | How to Check It | What a Gap Tells You |
|---|---|---|
| Map pack position by condition query | Monthly searches from fixed locations | Relevance or prominence is weaker than the leaders’ |
| Review count | Count on each competitor’s Google Business Profile | Fewer patients are being asked for reviews |
| Review recency | Dates of the newest ten reviews | The review request process has stalled |
| Owner responses | Share of reviews with a reply | Patients see a practice that is not listening |
| Profile completeness | Categories, services, hours, and photos | Google has less to match against searches |
The fixes for each gap are documented in the local visibility guide, but the benchmark comes first, because it tells you which fix matters most in your market. A practice with strong reviews and weak condition pages needs different work than one with the reverse, and the physical therapy practice benchmarks market leaders watch make that difference visible.
Prominence also extends beyond Google’s own listings. Mentions in local media, links from community organizations, and clinician articles published on other sites all add to how well-known a practice is, and authority distribution is how those signals are built on purpose. Count them for your practice and for your top three competitors. Links and mentions are among the physical therapy practice benchmarks market leaders build slowly and competitors find hard to copy.
Not sure where your practice stands against the physical therapy practice benchmarks market leaders set in your area? The PT Authority Gap Assessment benchmarks your visibility, reviews, and content and shows what to build first.
When Physical Therapy Industry Average Metrics Help and When They Mislead
Physical therapy industry average metrics are tempting because they promise a quick answer to whether you are behind. The problem is that well-documented averages for PT marketing performance are hard to find, and many figures in circulation have no named original source and no published method. An average without a source or a method is not a benchmark, however often it is repeated. The physical therapy practice benchmarks market leaders trust are the ones they can trace to a source or measure themselves.
Credible benchmarks do exist for some practice questions, and they show what a good one looks like. The APTA benchmark report on hiring challenges found that the vacancy rate for outpatient physical therapy practices is 9.5%, nearly double the 4.8% U.S. national average for all industries. It names its publisher, its year, and its comparison point, and it comes from the third annual survey in its series.
What Makes Physical Therapy Industry Average Metrics Worth Using
- A named, original publisher, not a company repeating someone else’s figure
- A stated year and a described sample
- A definition that matches what you actually measure
- A comparison point, such as a national or prior-year figure
Measured against those tests, your own data usually wins. Twelve months of consistent tracking from your content systems, scheduling software, and profile insights tells you more about your direction than any national figure. Use outside averages for context and your own history for decisions. That record becomes the most useful of the physical therapy practice benchmarks market leaders keep, because no competitor has it.
This is also why the physical therapy practice benchmarks market leaders rely on are built into the work from the start instead of added later. In how we build a PT visibility system, the baseline measurement comes before the first page is published, so every later change can be compared with a fixed starting point.

Running a PT Competitive Benchmark Analysis on Condition Pages and Clinician Credentials
Rankings and reviews show where competitors stand, and a PT competitive benchmark analysis of their websites shows why. Pick the three practices that appear most often in your local results, then compare what each one publishes for the conditions you most want to treat. Those three practices set the physical therapy practice benchmarks market leaders you are actually measured against.
That comparison overlaps with a broader competitive authority analysis, but the benchmark version is narrower and repeatable. You are counting specific things on a schedule so you can see movement, not writing a one-time strategy document. The physical therapy practice benchmarks market leaders set on their websites change every time they publish, so a repeatable count catches that change early.
What to Count in a PT Competitive Benchmark Analysis
- Condition pages: how many conditions each practice covers with a dedicated page
- Depth: whether each page answers patient questions or repeats one generic paragraph
- Clinician bio pages: names, credentials, and specialties shown on the site
- Supporting articles: how many link back to each condition page
- Freshness: when the pages were last updated
Clinician credentials deserve their own column. Patients compare who will treat them, and a competitor that lists board certifications and specialty training on every bio page shows a trust signal your site may be missing. The clinical authority guide covers how to present those credentials, while the benchmark tells you how far ahead or behind you are.
Score each item the same way every quarter and keep the scores in one sheet. The physical therapy practice benchmarks market leaders set in these columns move slowly, which is the point: a quarter-by-quarter record shows whether your content work is closing the gap or only keeping pace.

What Most PT Practices Get Wrong Chasing Physical Therapy Practice Benchmarks Market Leaders Ignore
Most owners who start measuring do it with good intent and the wrong targets. They chase vanity numbers, copy the top competitor, or check results so often that noise looks like a trend. Each mistake below is a way of reading the physical therapy practice benchmarks market leaders track without the context behind them. These are the questions owners ask most often once the tracking begins.
Should we copy whatever the top-ranked practice is doing?
Copying shows you what worked for them, not why it worked. The top practice may rank on years of accumulated reviews and links that a copied page cannot reproduce, and the content SEO playbook explains how topical depth builds over time. Benchmark their coverage, then build your own.
Is ranking first for our practice name a useful benchmark?
Not on its own. Patients who search your name already know you, so the measure that matters is visibility for condition and near-me searches from patients who do not. Name searches are one of the physical therapy practice benchmarks market leaders mostly ignore for that reason.
How often should we check our numbers?
Monthly for pipeline and review measures, and quarterly for content and competitor comparisons. Checking daily mostly measures noise, since local results shift with searcher location and timing. The physical therapy practice benchmarks market leaders watch are trends over months, not single readings.
What if a competitor has far more reviews than we do?
Look at their recent reviews before their total. A large count built years ago matters less to a patient than a steady flow from the last few months, and recency is a gap you can start closing this week by asking every finishing patient for a review. Recency is one of the physical therapy practice benchmarks market leaders cannot coast on, because it fades every month.
Can we benchmark patient education content?
Yes. Count the patient questions your condition pages and articles answer compared with competitors, and check whether patients can find those answers easily. An educational hub structure makes that comparison simpler, because every topic has one home.
Ready to build the visibility, review, and content systems that move your practice up the benchmarks that matter in your market?
An Honest Way to Set Your Own Targets
The honest way to use the physical therapy practice benchmarks market leaders track is to stop looking for a national pass mark. Set your baseline this month, pick the three local competitors patients actually see, and set targets against them and against your own last twelve months.
Targets should follow capacity. A practice that can see ten more evaluations a week needs a different visibility target than one with a waitlist, and our approach starts every build with that question instead of a generic growth number. Benchmarks serve the schedule, not the other way around, and the physical therapy practice benchmarks market leaders choose always reflect what their practice can actually absorb.
Each measure in this article connects to a deeper guide in the PT resource library, from local search to condition content to patient acquisition. Use those guides once the benchmark shows you where the gap is.
The honest answer is that most practices are closer to the market leaders than they think on expertise and further behind on infrastructure. Benchmarks show the distance, and a connected system is what closes it.